Blog

  • Growing demand for digital privacy and how it might affect Monero

    Growing demand for digital privacy and how it might affect Monero

    There are a number of indicators that Monero usage is growing.

    For example, the chart below shows quarterly transaction volume since 2016:
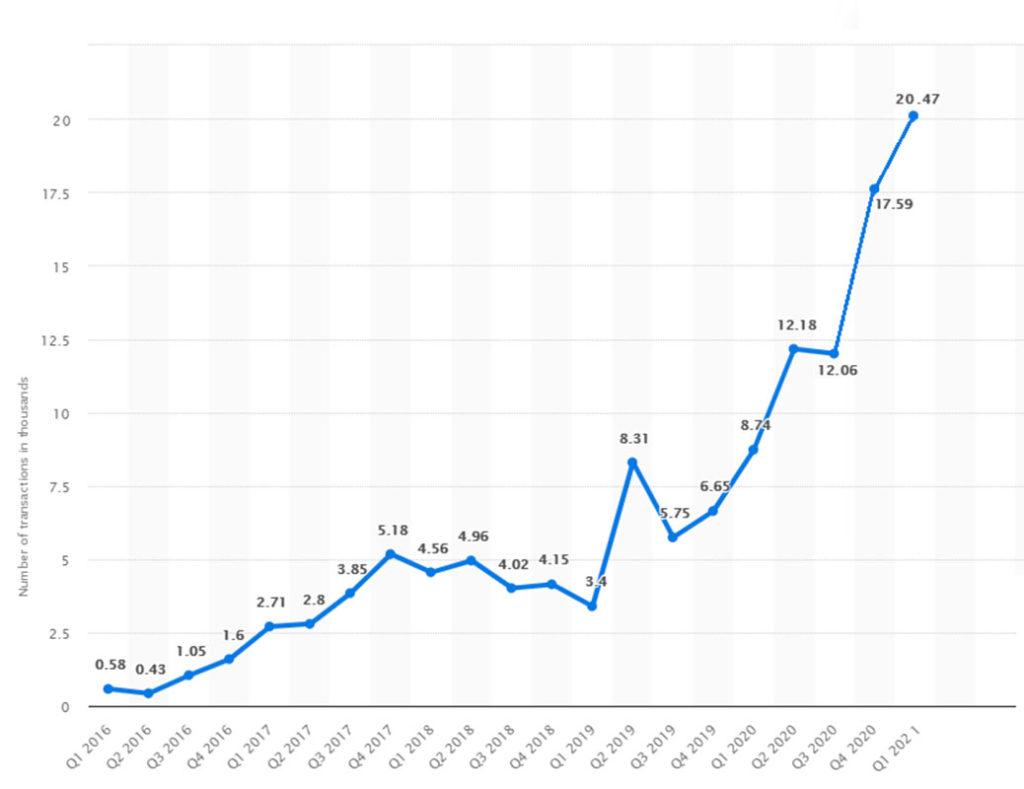
    Monero transaction volume graph
    Image via /u/Febos on Reddit. A good source for Monero transaction data is BitInfoCharts

    Another data point we have is the growth in usage of a popular mobile Monero focused wallet called CakeWallet. After launching in 2018, it took until December 2020 before they reached 60,000 installs (source), then just 4 months later, they reached 100,000 installs (source).

    Part of this could have been to do with them adding Bitcoin support in Jan 2021 – but that probably isn’t the whole story.

    Cake wallet celebrating 100k installs on X.com
    Image via Twitter

    Based on the above data points – Monero certainly seems to be growing.

    In this blog post we’re going to look specifically at the nascent field of “digital privacy”, how it’s also growing, and how Monero might be affected by this.

    14 years ago there was very little concept of “digital privacy”.

    In part, because the digital world was still being created. There was no iPhone, no Instagram, Whatsapp, or Twitter. Smartphones and social networks were still in their infancy.

    Back then our phones weren’t tracking our every movement, and there was no United States PRISM surveillance program.

    Back then many of us would voluntarily give our personal information to online services, naive to how it may later get used (and leaked).

    However, in the years since, we’re globally starting to wake up to the need to protect our digital privacy.

    Below we’ll look at some metrics we can use to gauge the growth of digital privacy.

    Metrics

    Whilst it’s not easy to reach into the global hive mind and measure exactly how their perception of digital privacy is changing, we can at least fumble around with some basic metrics to give us an idea.

    Subreddits

    As readers may already know, Reddit.com is the most popular message board globally. At the time of writing, it’s ranked #19 most popular site globally, and #7 in USA (via Alexa.com). It comprises of “subreddits”, which are topic focused message boards. A number of them are privacy focused, and so measuring their growth over time is interesting. Data comes via subredditstats.com.

    Below you can see below the growth in subscribers (blue line) of the subreddit /r/privacy. Growing approximately 8x since Jan 2018.
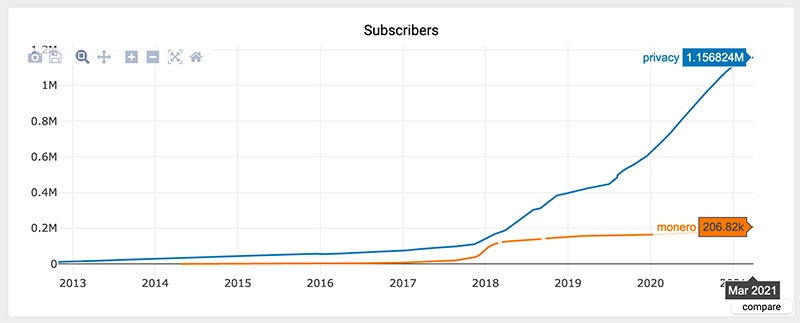
    Monero subscriber growth on Reddit

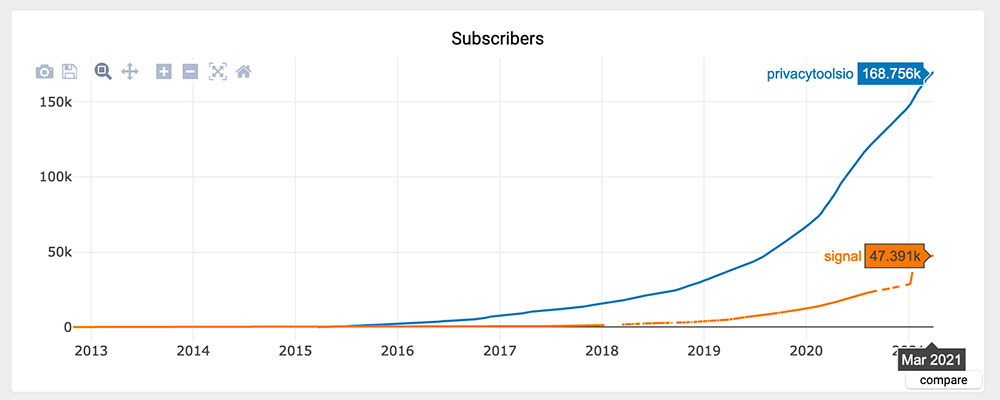
    Similarly, we can see that the subreddit growth for PrivacyToolsIO and Signal Messenger are growing rapidly also:
    Monero subscriber growth on Reddit

    Users of these subreddits are actively engaged in learning and talking about privacy related technology. They’re likely to be “early adopters”.

    Private Search Engines

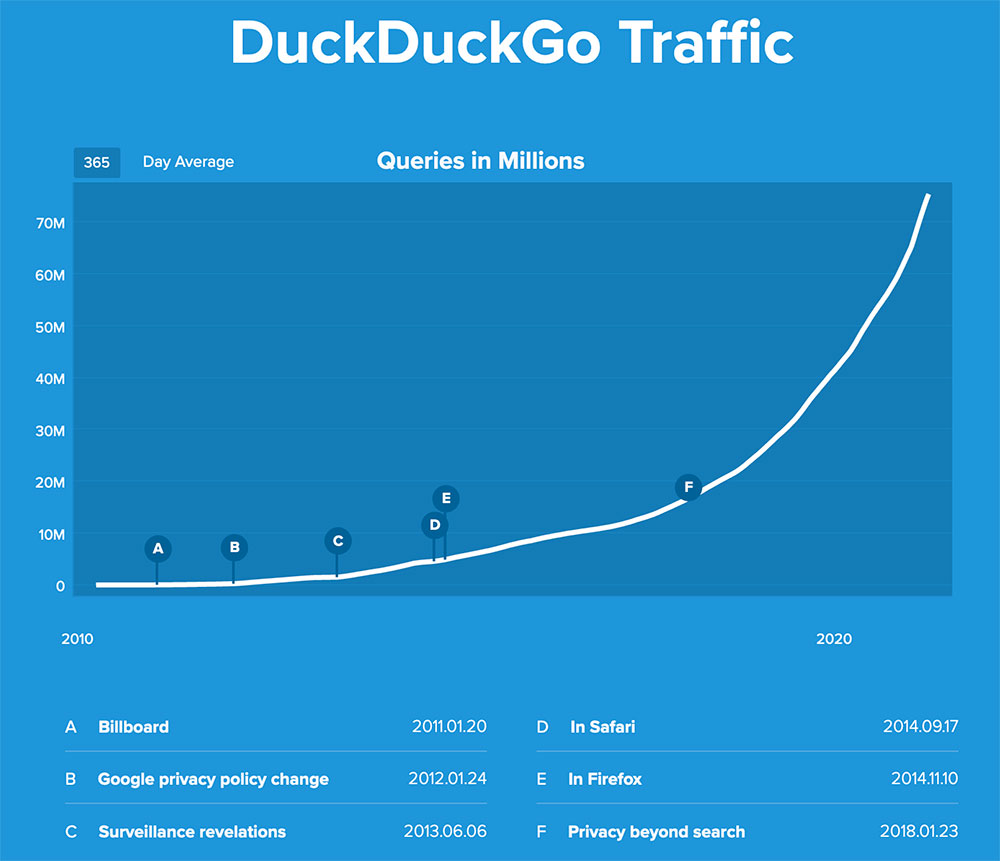
    Whilst there are a growing number of privacy focused search engines, the most well known one is DuckDuckGo. They openly share the number of daily queries here. Since 2018 this has gone up around 4.5x.
    DuckDuckGo Traffic growth graph
    Image source: duckduckgo.com/traffic

    Other

    Whilst the subreddit and duckduckgo growth are the cleanest, most reliable metrics I can find. There are other sources that point in a similar direction:

    • 1Password, the password manager tool that helps people store and use unique complex passwords for their web logins, reported that since hiring a CEO in 2012, they’ve gone from 20 to 174 employees (Nov 2019 source).
    • Tutanota, the privacy focused email service, wrote in 2017 that they were globally ranked #35,515 for traffic (via Alexa). At the time of writing they’re globally ranked #24,665, showing a big improvement.
    • Signal Messenger, which uses end to end encryption for message content, recently surged in popularity, after Whatsapp announced they would start sharing data with Facebook in North America. Causing Signal to temporarily shoot to the top of download charts.

    Apple's App store Social Network chart - showing signal at the top

    Privacy in Popular Culture

    The Social Dilemma

    If you said a couple years ago that Netflix would release a documentary that touches on the privacy issues around social media, and it would notch up more than 38 million views – I’d have been surprised. But indeed, that’s what’s happened with The Social Dilemma – when it was released on Netflix in early 2020.

    It looks at the way social media companies use our data to help manipulate us into doing things they want – such as spending more time on their platforms so they can show more ads.

    Social Dilemma movie image

    Apple on Privacy

    Apple, currently the largest company in the world by market cap, is running ads talking about privacy.

    It has clearly made a bet that people will buy their products if they associate them with privacy.

    Below are 4 examples of their privacy focused ads.

    Privacy Growth Roundup

    As we can see from the charts above, the global interest in digital privacy is increasing rapidly.

    The charts suggest that somewhere between 2015 and 2018 things picked up speed.

    This growth trend is likely to spur more growth, in at least 3 ways:

    1. More users = better products. Increased real-world product testing, product feedback and feature requests will lead to improved products that are more attractive to existing and potential new users.
    2. More users = more money (assuming the product has a revenue model). More money provides an incentive to keep improving products. It’s also likely to foster new product competition, from entrepreneurs who want a piece of the growing pie. In turn, increasing the range and quality of the products users have access to. Better products = a stronger carrot to lure users away from their existing products to privacy preserving products.
    3. More users = more education. As more people learn and use privacy preserving products, they’re then more likely to go on and spread that knowledge with people in their social network. Education is a large piece of the puzzle.

    How Might This Affect Monero?

    Whilst the above products mentioned all play a role in protecting digital privacy, none of them specifically address the issue of financial privacy.

    Monero currently sits atop a very short list of digitally native currencies that preserve user’s privacy.

    Right now, the people aware of Monero either come across it because they really need it, or because they’re interested in cryptocurrencies and hear of it that way.

    However, as we can see, digital privacy awareness is growing, and it’s plausible that a small percentage of these people will, in time, come across Monero and realize it’s impressive utility.

    Whilst it’s unclear how that translates numerically to Monero’s growth, it seems Monero is well positioned to benefit from the growth in the sector.

    A man surfing a wave with the Monero logo on his head

    Roundup

    Hopefully the article was helpful in terms of the research around digital privacy growth.

    If you have any questions or comments, please leave them below.

  • Link to Monero Timeline – A list of key developments

    Link to Monero Timeline – A list of key developments

    I created a Monero Timeline – which highlights key milestones in Monero’s development since 2014.

  • Monero Stock to Flow (S2F) Calculated

    Monero Stock to Flow (S2F) Calculated

    In this article we’re going to look at Monero’s stock to flow, which is a way of evaluating its future scarcity.

    But first, if you’ve arrived at this post looking for the Monero equivalent of Bitcoin’s stock to flow model, you can find something similar at Twitter user CryptoMorpheus‘ website here.

    His model emulates the stock to flow pricing model that was popularized in Bitcoin via Plan B, and later turned into a website.

    It’s worth noting that whilst the Bitcoin model has been relatively accurate in predicting its future price, it’s unclear if the model by CryptoMorpheus will accurately predict the future price for Monero.

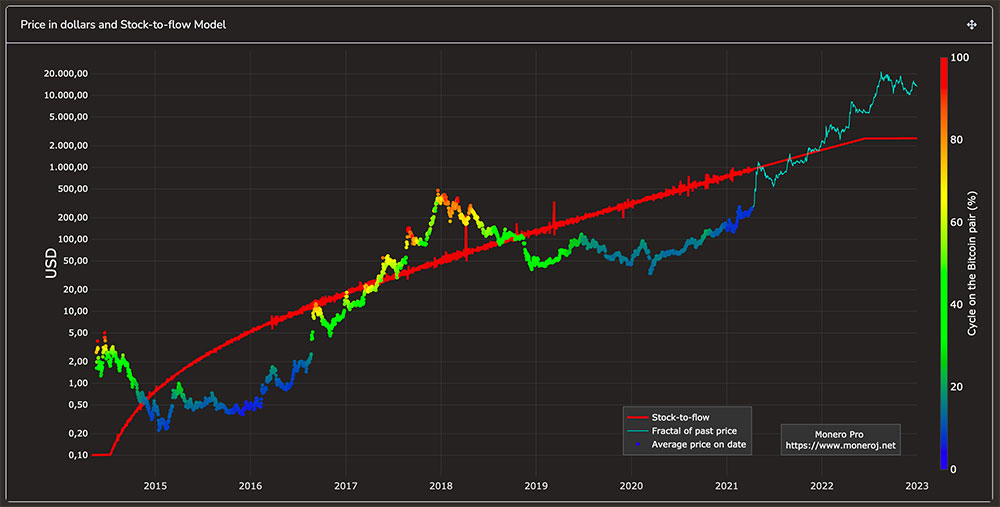
    Monero S2F graph
    Image of Monero Stock to Flow model – via moneroj.net/sfmodel

    The rest of the post will focus on the concept of ‘stock to flow’, rather than ‘stock to flow price models‘, so it’s important to separate out those concepts.

    Stock to flow is a way to look at how scarce a resource is.

    Stock to flow price models are a way to to combine stock to flow with historic price data, and model future price predictions.

    *So this post is going to look at stock to flow, but why is that important?* Well, if we can understand how scarce an asset Monero is, we can compare it to other assets and start to make future price/value predictions.If it turns out the asset isn’t very scarce, relative to existing supply, then we know not to place too high a value on it.Stock to flow is particularly relevant to cryptocurrencies, which often often have a fixed emission curve. Versus fiat currencies, where central banks continue to inflate the supply at will.

    Calculating stock to flow is a simple equation, it’s:

    Stock (total in circulation) / Flow (total added per year)

    So in Monero context, stock would be how much Monero is already mined and in circulation, and flow would be how much Monero is being created when each block is mined, multiplied out to represent 365 days worth.

    The result of the equation gives you a number. The higher the number, the more scarce the resource is going forward.

    At the time of writing (Jan 15, 2021), the stock to flow of Monero is:

    Stock (17,813,880) / Flow (317,988) = 56

    How to find the stock?

    You can use bitinfocharts.com/monero/ to get the latest figure for the total Monero in circulation.

    How to find the flow?

    Again, you can use bitinfocharts.com/monero/ to get the latest figure for the block reward.

    For example, in the above calculation, the block reward (every 2 minutes) is 1.21 XMR. So then you need to do:

    1.21 x 30 x 24 hours x 365 days = 317,988 XMR

    317,988 is the Flow – which is the emission rate per year.

    It’s worth noting that with Bitcoin, the emission rate only changes once every 4 years. However with Monero, we’ll be decreasing from 1.21 to 0.6, between now and May 2022. At which point it will stay at 0.6 XMR per 2 minute block perpetually (“forever”).

    The only thing that would change the emission rate is if the developers agreed to change it in the code. Currently that isn’t a topic under discussion.

    How to combine the stock and flow?

    Once you’ve got your figure for the stock, and the flow, just do:

    Stock / Flow (stock divided by flow)

    For a bit of historical context, the table below shows the estimated stock to flow of precious metals.

      Stock (tonnes) Flow (tonnes) Stock to Flow Growth
    Gold 185,000 3,000 62 1.6%
    Silver 550,000 25,000 22 4.5%
    Palladium 244 215 1.1 88.1%
    Platinum 86 229 0.4 266.7%
    Calculations courtesy of Plan B (source)

    Note that Gold, which is regarded as a scarce asset, has an approximate stock to flow of 62. That gives a mental benchmark for what’s rare and what isn’t. With lower numbers equaling less rare.

    Comparing Monero to Bitcoin and Gold

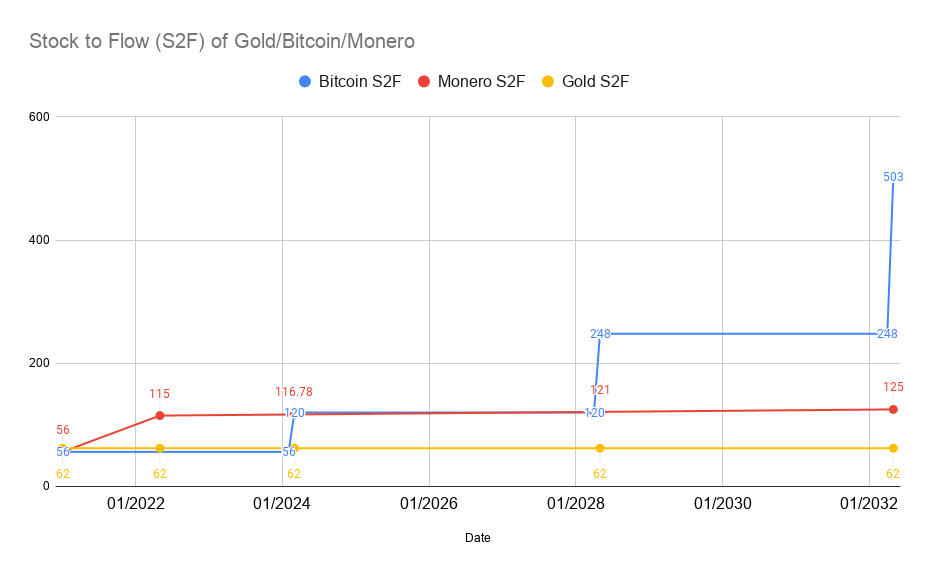
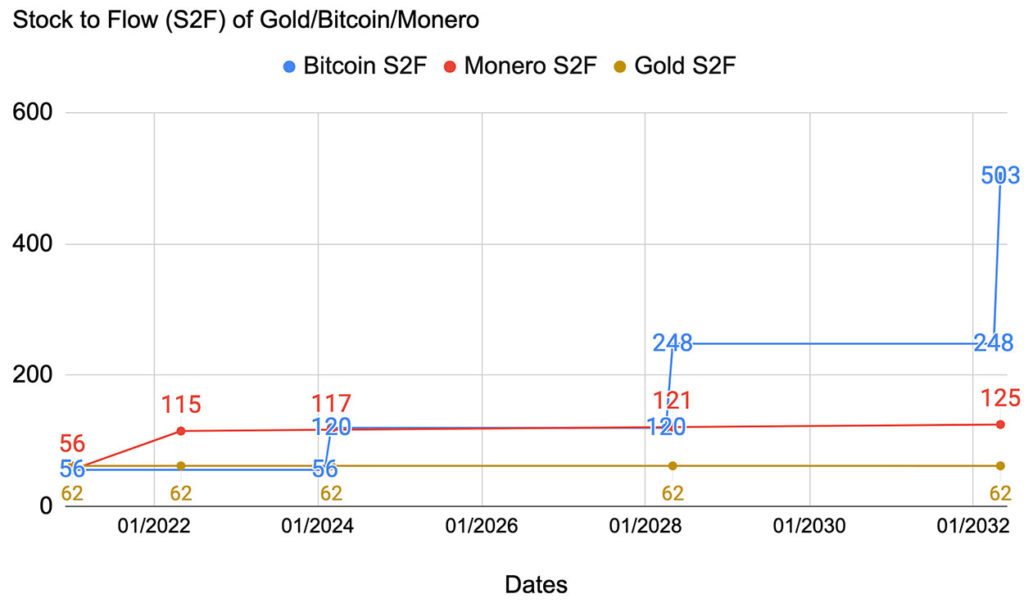
    The chart below illustrates how Monero’s stock to flow compares to Bitcoin and Gold.

    Monero S2F graph
    Apologies for the graph not being super easy to read. View the source data on Google Sheets here.

    Essentially, once Monero’s tail emission kicks in around May 2022, Monero’s stock to flow stays roughly flat at around 115 – notably more scarce than Gold, which is around 62.

    Then from May 2022 to March 2024, Monero supply is more scarce than Bitcoin. Around March 2024, Bitcoin’s supply halves, and then until 2028 the scarcity of new coins for Bitcoin and Monero is roughly comparable.

    From 2028 and beyond, Bitcoin’s scarcity continues to increase dramatically. The table below shows how Bitcoin’s stock to flow increases with each halving:

    Date Stock Flow Stock to Flow Block Reward
    2020 Halving 18,375,000 328,500 56 6.25
    Jan 15 2021 18,601,200 328,500 56 6.25
    2024 Halving 19,687,500 164,250 120 3.125
    2028 Halving 20,343,750 82,125 248 1.5625
    2032 Halving 20,671,875 41,062 503 0.78125
    2036 Halving 20,835,937 20,531 1015 0.390625
    2040 Halving 20,917,968 10,265 2038 0.1953125
    2044 Halving 20,958,984 5,132 4083 0.09765625
    2120 Halving 20,835,937 0.0021024 9,988,584,457 0.000000040
    Source for some of this data – Bitcoin Wiki

    Monero’s Scarcity over the next 100 years

    Due to Monero’s tail emission being fixed, the stock to flow will gradually increase over time, as the existing stock grows relative to the fixed annual flow.

    Below you can see how, by 2122, Monero’s stock to flow reaches 215, approximately 4x what it is at the time of writing.

    Date Stock Flow Stock to Flow Growth
    Jan 15 2021 17,813,880 317,988 56 1.78%
    May 2022* 18,132,306 157,680 115 0.87%
    2122 33,900,306 157,680 215 0.46%
    *May 2022 estimate via this spreadsheet, then added 100*157,680 to get 2122 value

    What about Ethereum?

    Ethereum has long had the second highest aggregate value, in USD, after Bitcoin. But is it “hard money”?

    Calculating the stock to flow of a cryptocurrency gives us a point in time value for the scarcity – but it doesn’t tell us how scarce the asset will be in the future.

    For that, we need to rely upon what the code says, and what the “social contract” of the cryptocurrency says.

    For example, in Bitcoin, the code says there will only be 21m Bitcoins, and the “social contract” around the 21m means that there will be 1,000s of angry people if ever there was a proposal to increase Bitcoin’s supply.

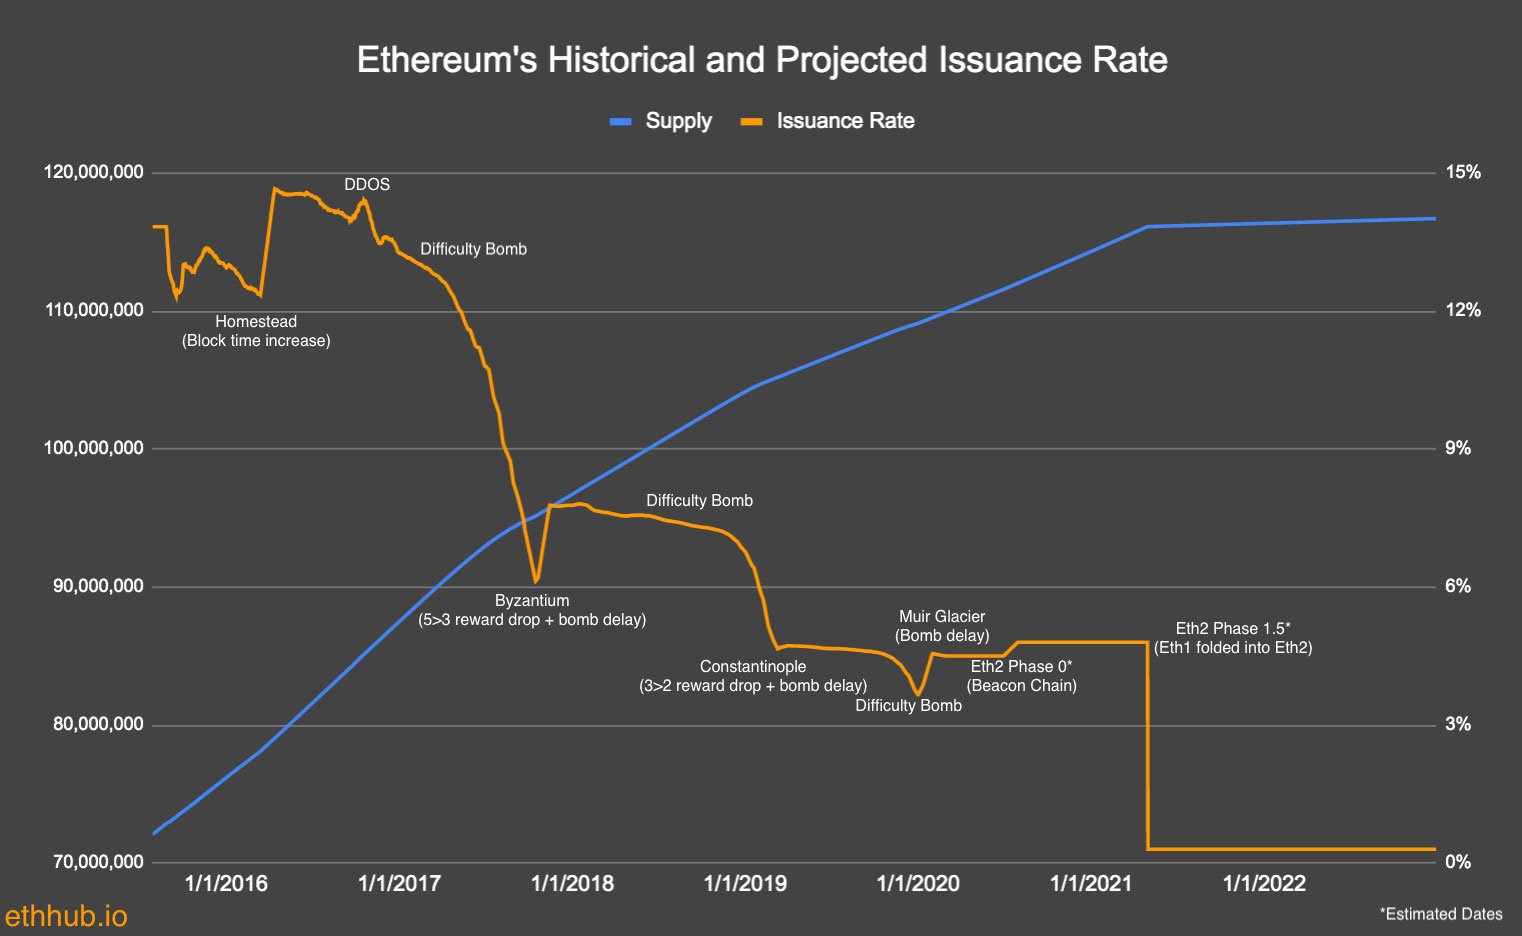
    With Ethereum on the other hand, the issuance has historically been less stable and predictable. See the chart below, coming via ethhub.io:

    Eth Issuance Graph
    Image via ethhub.io

    Each of the points on the chart are various architecture changes that have effected the supply curve:

    1. Homestead
    2. Byzantium
    3. Constantinople
    4. Muir Glacier
    5. Eth2 Phase 0
    6. Eth2 Phase 1.5

    As an experimental technology, that’s fine, Ethereum is charting new territory with the scaling of its smart contracts, and they’re figuring things out as they go.

    However, if you’re trying to forecast Ethereum’s future stock to flow, and use it as component in estimating it’s future per unit value, all these past changes introduce uncertainty into your model.

    Will the emission curve stay flat, as per the graph, or will future upgrades require a change? It’s not 100% clear.

    So rather than me peering into my crystal ball to give you an answer, I’d like to instead leave you with a thought.

    On top of stock to flow being important, so is the project’s track record of changing the emission curve. So far, Bitcoin and Monero’s track record is solid, and no changes have been made.

    All that said, it’s important to point out that I’m not saying ETH isn’t valuable, or that it won’t continue to grow in value. I’m simply pointing out that using stock to flow for ETH’s valuation has some risk, given the project’s past record of changes.

    Roundup

    When looking for a “safe” store of value, one of the metrics to understand is the stock to flow. If you come across an asset, like Gold, that has:

    • Relatively high stock to flow
    • High probability that the rate of supply will not change

    This rules out the risk that the supply will be greatly inflated, making it a safer store of value.

    Of course, the stock to flow on its own is worthless, but as a component needed in building a bigger picture of an asset’s value, it’s useful.

    Related Links

    There’s an interesting interview with PlanB and Pomp, where PlanB discusses the Bitcoin stock to flow model from 24m 10s.

  • The internet arms race, and the need for resilience

    The internet arms race, and the need for resilience

    The internet has unlocked a myriad of opportunities. These opportunities are going to both create and destroy industries and careers.

    If you’re young and nimble, it’s not so bad. If you’re old and stuck in your ways, it could be disastrous.

    Whichever side of the coin you’re on, unless you’ve got wealth safely stored away in inflation-resistant assets, it’s going to mean disruption.

    These coming changes make the need for individual resilience more important than ever.

    Below is a little narrative I wrote in 2019, but still applies today (I think). The 2020 Covid pandemic only accelerated things, and Chat-GPT confirmed them.

    First, let’s paint a picture

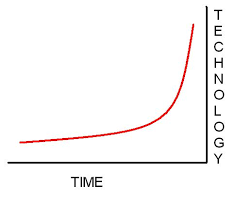
    It’s 2019, and we’re on an exponential growth curve in terms of technological progress.

    Exponential tech improvement graph

    It’s possible right now to life in extreme comfort and convenience, however for the majority, this is out of reach.

    rich vs poor illustration
    Image credit chappatte

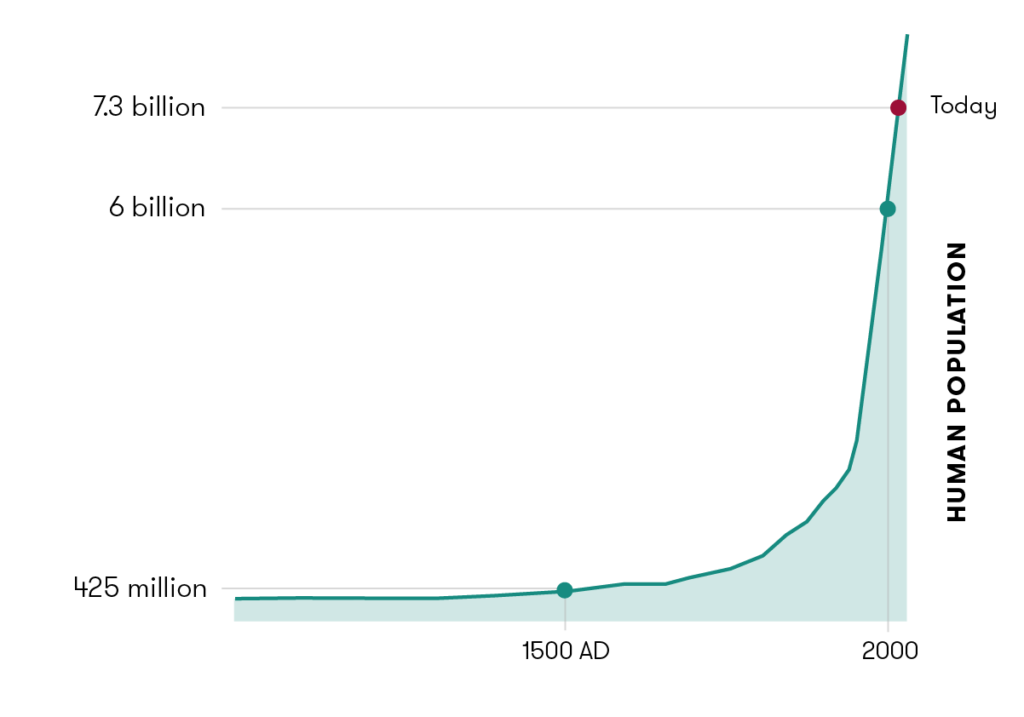
    60 years ago there were ~3 billion people on the planet. Right now there are over 7 billion. By 2050 there will be almost 10 billion.

    growth of human population graph
    Image source: Our World in Data

    There’s a huge global competition for resources, help fueled by almost universal access to the internet.

    This levels the playing field, meaning a poor child in Africa can access the world’s knowledge similar to the way a wealthy Western child can.

    Africa kids watching tablet

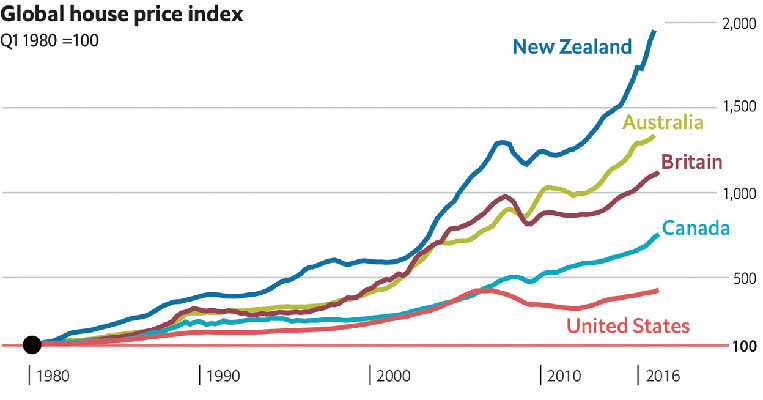
    Major cities are already feeling this strain of population growth and knowledge dispersal – with mass migration towards major hubs pushing their housing market prices to all-time highs.

    Global house price index
    Image source: The Economist

    Large-scale migration from less economically developed areas, to more economically developed areas continues to increase. Accelerated by access to smartphones and better transport.

    Migrants getting off a boat
    Image Source: Huffington Post

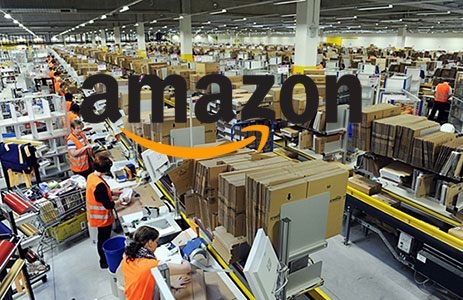
    Corporations continue to grow in size, wealth and influence. Setting high customer experience standards, and making it difficult for independent businesses to compete.

    Inside amazon warehouse
    Image source: Tucson Sentinel

    Robot and computer automation continue to reduce the labor force required, and this trend shows no abating.

    robot kicking an office worker out of the office
    Image source iee.org

    We are all participating in a technological arms race for resources, whether we like it or not.

    This technological shift, like all the ones that have gone before it, is going to cause massive disruption to the way we live our lives.

    Right or Wrong? Good or Bad?

    Whether these changes are right or wrong can be debated, what we know for sure is that they ARE happening – and the rate of change is only going to increase.

    Are these changes good or bad? As with any disruption, there will be newly created opportunities, but there will also be destruction. To thrive we need to be switched on to the opportunities

    woman seeking opportunity - art
    Image source: glaziang.com

    Resilience

    Resilience

    1. the capacity to recover quickly from difficulties; toughness.

    2. the ability of a substance or object to spring back into shape; elasticity.

    I have no doubt that humans are by default, resilient.

    man stopping dominos from falling
    Image source: safety4sea

    But I also believe that there are specific things we can do to increase our resilience.

    Example: Take a radiographer in the year 2021, who “all of a sudden” has their job replaced by a computer that is 10x faster and more accurate than the best human radiographer. Can this now unemployed, yet capable human bounce back from losing their job, and quickly earn a new income? Absolutely.

    Would be easier however if they had already diversified their income streams, created an emergency cash fund and cleared off unnecessary debts? No doubt.

    Time & Money

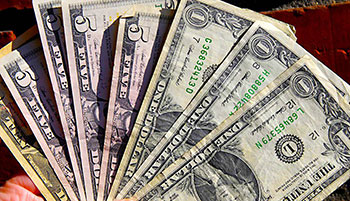
    US dollars displayed in hand
    Image Source: Project Syndicate

    Money transformed society into what we take for granted today.

    Its ability to be exchanged for (almost) anything makes it very useful for resilience.

    Can money fix my health? No, but it can give me access to medical care and health experts who can help.

    Can money bring me friends? No, but it can buy me the time to seek out people of like mind.

    Can money bring me happiness? No, but it can help me avoid things that take away from happiness, and pay for activities that bring excitement.

    the mastercard saying

    We know that money doesn’t solve everything, but we also know that lack of money is a huge impediment to one’s choices in life.

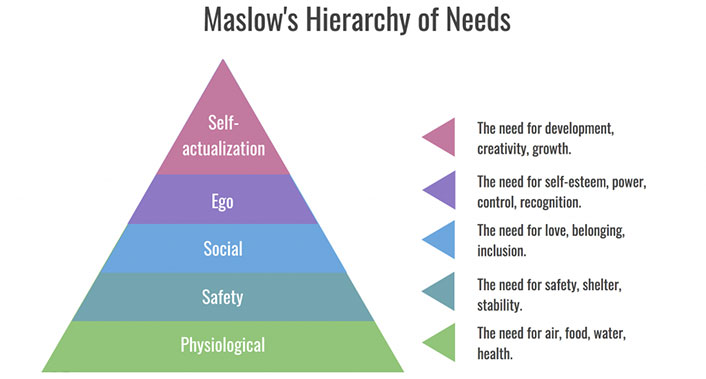
    Maslow’s Hierarchy: At an extreme, lack of money restricts how far you can climb on Maslow’s hierarchy of needs. One of the reasons that developing countries struggle to organize and improve their collective standard of living is that their citizens lack the basic bottom rungs of Maslow’s hierarchy. Things like clean water, nutritious food, safety, and stability. Without those, unfortunately, humans revert to survival mode, which means they live day to day, and have difficulty planning for the long term.

    Maslow's hierarchy image
    Image source: Peachey Publications

    Now that’s an extreme, but also in “developed” societies, similar principles apply.

    Until you can build some financial security, your ability to think and plan long-term is impaired. Making financial security foundational to a resilience strategy.